ATTOM’s Property Reports include the ability to find and filter comps—including private sales— based on location, date, price, and and a range of property attributes.
Sign Up NowProperty Report for 2022 Huron St, Bellingham, WA 98229
Find Comparables
View Map Layers
Subscribe to unlock map layers including flood zones and tax parcels
Property Details
- Property Address 2022 Huron St, Bellingham, WA 98229
- County Whatcom
- Parcel ID 380328 180440 0000
- Legal description WHATCOM FALLS HEIGHTS ADD TO BELLINGHAM LOT 14 BLK 4
- School district Bellingham School District
- Acreage 0.22
- Property class Single Family Residence
- Zoning Subscribe
- Square footage 1,208
- Year built 1957
- Bedrooms 3
- Bathrooms 1
About the Property
2022 Huron St is a single family residence in the city of Bellingham, WA 98229. Located in the Bellingham School District, which resides in Whatcom County, WA and built in 1957. This Single Family Residence sits on a 9,583 sq ft lot and features 3 bedrooms, 1 bathrooms and 1,208 sq ft of living space.
The most recent property tax for 2022 Huron St was $4,913 with an estimated market value range of $743,343 to $758,360. This property was last sold on July 15, 2015 for $265,000.
Property Info
Sign up to see full Property Info for 2022 Huron St, Bellingham
Flood
Legal
- WHATCOM FALLS HEIGHTS ADD TO BELLINGHAM LOT 14 BLK 4
- Classification SINGLE FAMILY RESIDENCE
- County WHATCOM
- FIPS 53073
- Civil Division BELLINGHAM
- Census 530730008.031011
- Parcel ID 380328 180440 0000
- Neighborhood WHATCOM FALLS HEIGHTS
- Tract 0
- Secondary School District N/A
- Primary School District Bellingham School District
Ownership
Land
- Acres 0.22
- Square Feet 9,583
Building
- Units N/A
- Year Built 1957
- Effective Year Built N/A
- Stories 1
- # Fireplaces 1
- Garage/Carport 338 sq.ft.
Utilities
- Cooling N/A
- Heating Baseboard
Interior
- Square Footage
- Living Area 1,208
- Total Rooms N/A
- Bedrooms 3
- Total Bathrooms 1
- Full Bathrooms 1
Your Property Report will also include the following information:
How can you use ATTOM Property Reports?
Power up your client responsiveness, productivity, and transaction speed with the most comprehensive data.
Make faster decisions based on extensive property information that includes purchasing, selling, listing, and mortgage data.
Comparative market analysis facilitates credible valuations that will move inventory and ease transactions.
Discover how much your home or prospective home is worth and compare to nearby houses
Try before you buy— examine our free sample report and all the rich data it contains.
Start Free TrialBellingham Residential Market Stats
Median Sale Price
$725,000
+2.1% YoY
Median Price/sq ft.
$421
Whatcom County Median Sale Price
$725,000
+2.1% YoY
See more Real Estate Trends for Bellingham including home values, types of properties sold and transaction volumes.
Taxes and Assessments for 2022 Huron St, Bellingham
| Tax Year | Taxes | Tax Assesed Value | Exemptions |
|---|---|---|---|
| 2024 | $4,913 (+10.2%) | $600,773 (+37.9%) | |
| 2023 | $4,458 (+36.9%) | $435,532 (+31.6%) | |
| 2021 | $3,257 | $330,974 | |
| 2020 | |||
| 2019 | |||
| 2018 | |||
| 2017 |
Sales History for 2022 Huron St, Bellingham
The most recent sale on 2022 Huron St took place on Jul 11, 2015 and recorded on Jul 15, 2015 for $265,000.
Sign up for full access to the complete sales history including potential flips, distressed sales and buyer and seller data.
| Sale Date | Recorded Date | Buyer(s) | Seller(s) | Price | Document ID |
|---|---|---|---|---|---|
Recently Sold Comparables
These are nearby recently sold properties that are similar to this property, base on available data.
| Address | Distance | SqFt | Sale Date | Price | $/SqFt |
|---|---|---|---|---|---|
| 2210 ERIE ST | .17 mi | 1,200 | 04/03/2025 | $610,000 | $508 |
| 2235 HURON ST | .23 mi | 1,152 | 02/27/2025 | $771,000 | $669 |
| 914 E LAUREL ST | 2.14 mi | 970 | 07/03/2025 | $641,250 | $661 |
Our Property Reports contain multiple Automated Valuation Models showing low, median, and high values along with confidence scores.
Sign up to access
Sign up to access
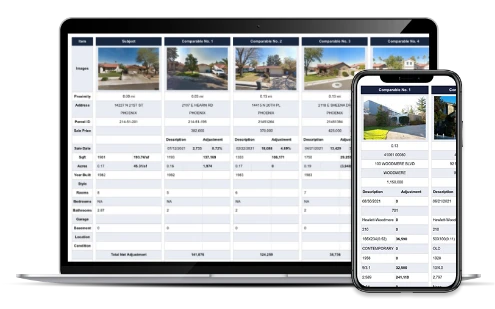
Find the Most Accurate Comparables
Nearby Cities
- 1. Bellingham
- 2. Lummi Island
- 3. Everson
- 4. Ferndale
- 5. Acme
- 6. Lynden
Various data sets have been provided by a third party or government source and are subject to change and possible errors. Depending on location and source, data may be missing or not available. Information is deemed reliable but not guaranteed to be accurate, up-to-date, or complete. Buyers, investors, and others are responsible for verifying the accuracy of all information.