
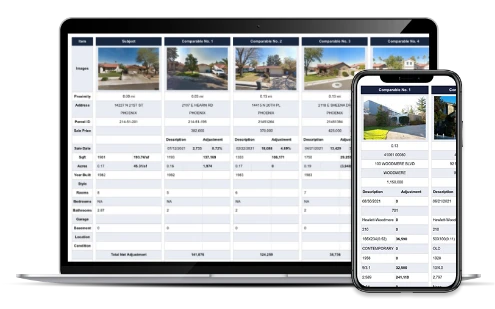
ATTOM’s Property Reports include the ability to find and filter comps—including private sales— based on location, date, price, and and a range of property attributes.
Sign Up NowProperty Report for 59 Hudson St # B, Boston, MA 02111
Find Comparables
View Map Layers
Subscribe to unlock map layers including flood zones and tax parcels
Property Details
- Property Address 59 Hudson St # B, Boston, MA 02111
- County Suffolk
- Parcel ID CBOS W:03 P:05296 S:006
- Legal description DIST:35 CITY/MUNI/TWP:BOSTON-CENTRAL BOSTON
- School district Boston School District
- Acreage 0.04
- Property class Industrial
- Zoning Subscribe
- Square footage 1,774
- Year built
- Bedrooms
- Bathrooms
About the Property
59 Hudson St # B is a industrial in the city of Boston, MA 02111. Located in the Boston School District, which resides in Suffolk County, MA. This Industrial sits on a 1,774 sq ft lot and features 1,774 sq ft of living space.
The most recent property tax for 59 Hudson St # B was $10,885. This property was last sold on January 22, 2025 for $450,000.
Property Info
Sign up to see full Property Info for 59 Hudson St # B, Boston
Flood
Legal
- DIST:35 CITY/MUNI/TWP:BOSTON-CENTRAL BOSTON
- Classification CONDOMINIUMS (INDUSTRIAL)
- County SUFFOLK
- FIPS 25025
- Civil Division BOSTON
- Census 250250702.021010
- Parcel ID CBOS W:03 P:05296 S:006
- Neighborhood N/A
- Tract 0
- Secondary School District Boston Day and Evening Academy Charter (District)
- Primary School District Boston School District
Ownership
Land
- Acres 0.04
- Square Feet 1,774
Building
- Units N/A
- Year Built N/A
- Effective Year Built N/A
- Stories N/A
- # Fireplaces N/A
- Garage/Carport N/A
Utilities
- Cooling N/A
- Heating N/A
Interior
- Square Footage
- Living Area 1,774
- Total Rooms N/A
- Bedrooms N/A
- Total Bathrooms N/A
- Full Bathrooms N/A
Your Property Report will also include the following information:
How can you use ATTOM Property Reports?
Power up your client responsiveness, productivity, and transaction speed with the most comprehensive data.
Make faster decisions based on extensive property information that includes purchasing, selling, listing, and mortgage data.
Comparative market analysis facilitates credible valuations that will move inventory and ease transactions.
Discover how much your home or prospective home is worth and compare to nearby houses
Try before you buy— examine our free sample report and all the rich data it contains.
Start Free TrialBoston Residential Market Stats
Median Sale Price
$2,850,000
-6.6% YoY
Median Price/sq ft.
$942
Suffolk County Median Sale Price
$2,850,000
-6.6% YoY
See more Real Estate Trends for Boston including home values, types of properties sold and transaction volumes.
Taxes and Assessments for 59 Hudson St # B, Boston
| Tax Year | Taxes | Tax Assesed Value | Exemptions |
|---|---|---|---|
| 2025 | $10,885 (+0.9%) | $419,300 (-1.8%) | |
| 2024 | $10,793 (-0.4%) | $427,100 (-2.8%) | |
| 2023 | $10,839 (+14%) | $439,200 (+15.4%) | |
| 2022 | |||
| 2021 | |||
| 2020 | |||
| 2019 |
Sales History for 59 Hudson St # B, Boston
The most recent sale on 59 Hudson St # B took place on Dec 31, 2024 and recorded on Jan 22, 2025 for $450,000.
Sign up for full access to the complete sales history including potential flips, distressed sales and buyer and seller data.
| Sale Date | Recorded Date | Buyer(s) | Seller(s) | Price | Document ID |
|---|---|---|---|---|---|
Recently Sold Comparables
These are nearby recently sold properties that are similar to this property, base on available data.
| Address | Distance | SqFt | Sale Date | Price | $/SqFt |
|---|---|---|---|---|---|
| 33 CHESTNUT ST APT 5 | .61 mi | 1,440 | 08/21/2025 | $1,218,750 | $846 |
| 1 AVERY ST APT 19D | .23 mi | 2,036 | 08/08/2025 | $2,075,000 | $1,019 |
| 12 BRADDOCK PARK # 1 | 1.06 mi | 1,460 | 08/05/2025 | $1,655,000 | $1,134 |
Our Property Reports contain multiple Automated Valuation Models showing low, median, and high values along with confidence scores.
Sign up to access
Sign up to access
Find the Most Accurate Comparables
Nearby Cities
- 1. Boston
- 2. South Boston
- 3. Charlestown
- 4. Roxbury Crossing
- 5. East Boston
- 6. Roxbury
Various data sets have been provided by a third party or government source and are subject to change and possible errors. Depending on location and source, data may be missing or not available. Information is deemed reliable but not guaranteed to be accurate, up-to-date, or complete. Buyers, investors, and others are responsible for verifying the accuracy of all information.